Why do cycle times fluctuate in linked production lines? Finding out usually requires a lot of manual effort. Companies therefore do not investigate every anomaly, but only cycle time fluctuations with significant accumulation. In the future, this will change: AI approaches for pattern recognition in time series data can help to automate the analysis.
Intelligent production of the future
The vision of IIP-Ecosphere is an innovation leap in the field of self-optimizing production using networked, intelligent, autonomous systems to increase productivity, flexibility, robustness and efficiency. Therefore, the goal of the project implementation phase is to build a novel ecosystem – the Next Level Ecosphere for Intelligent Industrial Production (IIP-Ecosphere). This ecosystem enables a new level in intelligent production.
Several universities, research institutions and companies are participating in the project IIP-Ecosphere. The project is led by the Institute for Manufacturing Technology and Machine Tools (IFW) at Leibniz Universität Hannover.
To realize its vision and goal, IIP-Ecosphere envisions activities that facilitate the applicability of artificial intelligence (AI) methods in production and demonstrate them in real application scenarios. For this purpose, there is a close exchange between the researchers of the “Innovation Core” and the demonstrators in the “Easy Tech” section (see https://www.iip-ecosphere.eu/).
IFW and VWN develop a demonstrator
In industrial manufacturing, downtimes are associated with high costs. To counteract downtimes, research and development has so far focused more on avoiding downtime, for example through predictive maintenance of equipment and the use of alternative manufacturing routes through the production process. However, these approaches neglect delays (micro-disturbances) in individual process steps, which are propagated throughout the process chain and often further amplified in the process. In this way, even minor delays, barely noticeable by the employee, can result in high additional costs.
Comprehensive production data acquisition and the structured evaluation of this data already make it possible to identify even these smallest deviations in the manufacturing process. However, this requires the manual creation and maintenance of rule sets for the identification of process delays and anomalies. In addition, further efforts are incurred in the interpretation of the processed data. This prevents the production employee from quickly initiating targeted countermeasures.
Together with Volkswagen Nutzfahrzeuge (VWN), the IFW is developing a demonstrator. The goal is to develop an AI-based manufacturing analysis system for process monitoring and cycle time optimization in car body production. The system is intended to detect delays and malfunctions in the production process at an early stage and in an automated manner without manual effort, identify cause-and-effect relationships, and indicate critical errors, thus enabling a control loop that is close to the process.
Automated detection of anomalies
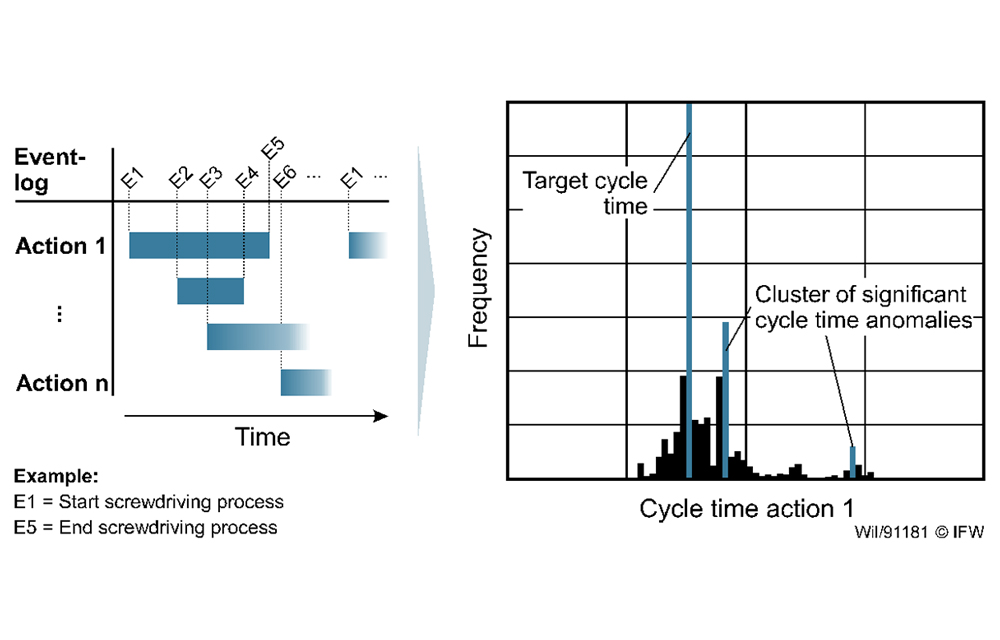
Intelligent cycle time optimization first requires the introduction of suitable routines for the automated calculation of cycle times. The basis for this is the recorded operating database. From event messages, for example the start and end of a screwdriving operation, the time windows of the associated actions can be calculated. The selected bottom-up approach provides for the cycle time to be calculated separately for each individual action as well as for each of its executions and visualized in an action cycle time histogram (see Fig. 2). The absolute maximum in the histogram corresponds to the target cycle time for the action under consideration; further local maxima that occur indicate systematic anomalies. With the help of an algorithm for automated peak detection, these can be reliably identified in the histogram.
In first experiments, data from three months and four different actions were considered. After manual parameterization of the algorithm, an error-free detection of systematic anomaly clusters was possible. By using artificial neural networks, the identification can be further automated. The production planner can be warned when previously defined threshold values for the relative occurrence frequency of a cluster of significant cycle time anomalies are exceeded. The methodical procedure is not application-specific and thus easily transferable to other plants. The manual creation of rule sets is no longer necessary.
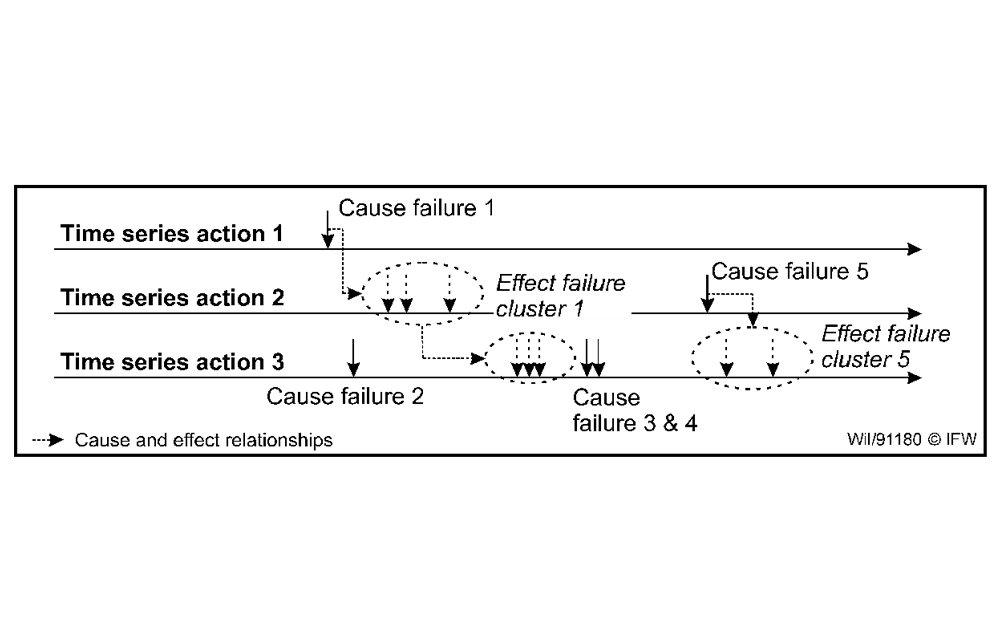
At this point, however, it is not certain that the identified anomalies are also caused by the associated actions (cause failure). Due to the tight buffer times in linked production lines, there is a possibility that cycle time deviations are caused by disturbances at upstream or downstream stations (effect failure). To automate this analysis as well, a cause-effect analysis is performed in the next step.
Cause-effect-analysis
The aim of the analysis is to distinguish between cause and effect failures without extensive manual effort and subsequently to automatically issue near-real-time warnings when cause failures occur via a suitable visualization. The starting point for this is the working hypothesis that when a cause failure occurs, at least one failure message is simultaneously registered for the station at which the cycle time anomaly was detected. If no message exists for the relevant time window, a effect failure can be assumed. The required message overview is available for the car body production line under consideration in a database with the associated start and end times. This enables a comparison with the time window in which the respective anomaly under consideration was detected.
The comparison of cycle time and message data results in a labeled time series data set that can be used to train intelligent prediction algorithms. The aim is to learn the cause-effect relationships between the different types of failures as shown in Fig. 3, to use this as a basis for predicting the consequences of cause failures in near-real time, and thus to enable near-process evaluation of any anomalies that occur. For example, the number and duration of expected effect failures can be used as an indicator for issuing warnings when the associated cause failure occurs. An intelligent display at the workstation, for example a live Gantt chart, indicates problem, cause and consequence to the machine operator. This facilitates the targeted and efficient initiation of countermeasures.
AI should reduce failures
A prerequisite for the efficient use of the solutions is data integrity and interoperability between different plants and factories. Therefore, interface standards for the transmission of machine data are met during method development. In addition, a suitable cross-plant data format for data storage and processing will be developed. This should also simplify the connection and use of external (analysis) tools.
In the future, linking automated process data labeling with AI methods should help to predict failure effects in near-real time and thus implement process-oriented control loops to reduce the actual resulting failure effect. The next step is to test suitable prediction algorithms. Here, for example, long short term memory methods will be considered.


