Fiber-reinforced plastics are important materials, especially for lightweight construction applications. The local orientation of the reinforcing fibers has a significant influence on the mechanical properties of the components. Their knowledge allows to refine and validate simulation models that predict the manufacturing process or the structural mechanical behavior. Simulation models that replicate reality as closely as possible can be used to optimize manufacturing processes and component properties.
Analysis of fiber orientations in such components, produced for example by injection molding, is often performed using micro-computed tomography (micro-CT). Micro-CT enables the non-destructive three-dimensional acquisition of samples in resolutions down to the sub-micrometer range.
In addition to determining fiber orientations, the method also enables metrology of component geometries, porosity or foam structure analysis, or in-situ tracking of damage initiation and propagation, for example as a result of mechanical loading.
Measurement time versus image quality
The volume captured in a micro-CT measurement is represented by gray values. The local gray value is primarily a measure of the X-ray absorption at that location. It allows materials with different absorption behavior, i.e. different densities, to be distinguished from one another. Glass fibers, for example, absorb X-rays more strongly than the surrounding plastic and therefore have a higher gray value.
The details that can be seen in a micro-CT image depend on many factors. In addition to the properties of the sample, the performance of the measurement system and the measurement parameters have a decisive influence.
The choice of measurement parameters always represents a compromise: Acquiring a sample with the highest possible resolution and image quality is only possible for a comparatively small sample volume and by accepting a long measurement duration, often several hours. Fast measurements and/or the acquisition of larger samples, on the other hand, are at the expense of detail detectability or general image quality.
Evaluation of image quality
The evaluation of whether a micro-CT image has sufficient image quality to perform certain analyses is currently largely subjective and based on experience.
For an objective evaluation of CT image quality, especially with regard to the analysis of fiber orientations, the Institute of Plastics and Circular Economy (IKK), with the support of Volume Graphics GmbH, is developing an image quality index that is intended to provide a measure of the distinguishability of fibers and matrix in plastic composites. The aim is to determine the minimum image quality index required for a reliable fiber orientation analysis.
On the one hand, this makes it possible to identify measurement parameters that are optimized in terms of measurement time and resolution. On the other hand, such an image quality index can also be used to compare different micro-CT setups with respect to their suitability for measuring this class of material or to monitor the performance of devices over time.
Development of an image quality index
Fiber orientation analysis using micro-CT measurements is based on the evaluation of gray-scale gradients in the CT volume. Good discrimination between fiber and matrix is essential to obtain valid results.
In order to reflect this distinguishability in the form of an image quality index, IKK has evaluated several methods for image processing and evaluation and adapted them to the specifics of the fiber-matrix composite. The gray value intensities and the noise level for both material components are evaluated and related to each other in the form of the image quality index Q. The results obtained are similar to contrast-to-noise ratios from classical signal processing.
A particular challenge in the analysis is the diameter of the reinforcing fibers used, which is often only a factor of 2 or 3 larger than the measurement resolution. This results in the necessity to distinguish the individual material components from each other with a high spatial sensitivity.
Case study of glass fiber-reinforced polypropylene
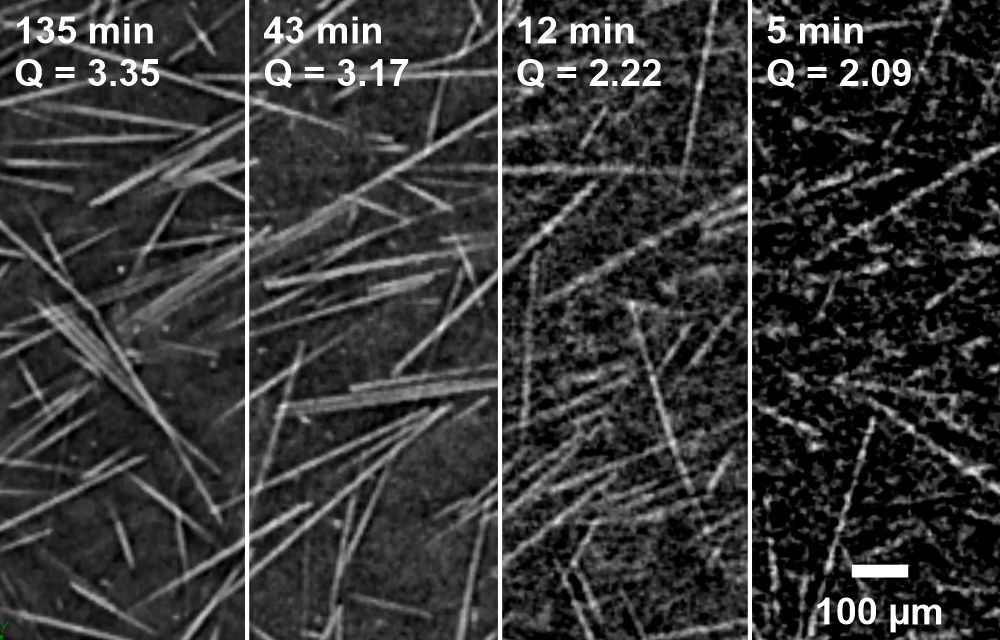
The effect of different CT measurement parameters on the image quality index and the resulting reliability of the fiber orientation analysis is illustrated using the example of a component made of glass-fiber-reinforced polypropylene produced by injection molding. All CT measurements shown (see Figure 2) were performed with a voxel resolution of 5 micrometers. At a measurement duration of 135 minutes, the highest image quality with good contrast and low image noise is achieved both subjectively and based on the image quality index Q of 3.35. As the measurement duration decreases, the subjective and determined image quality decrease continuously until a significantly reduced image quality is achieved at a measurement duration of only 5 minutes.
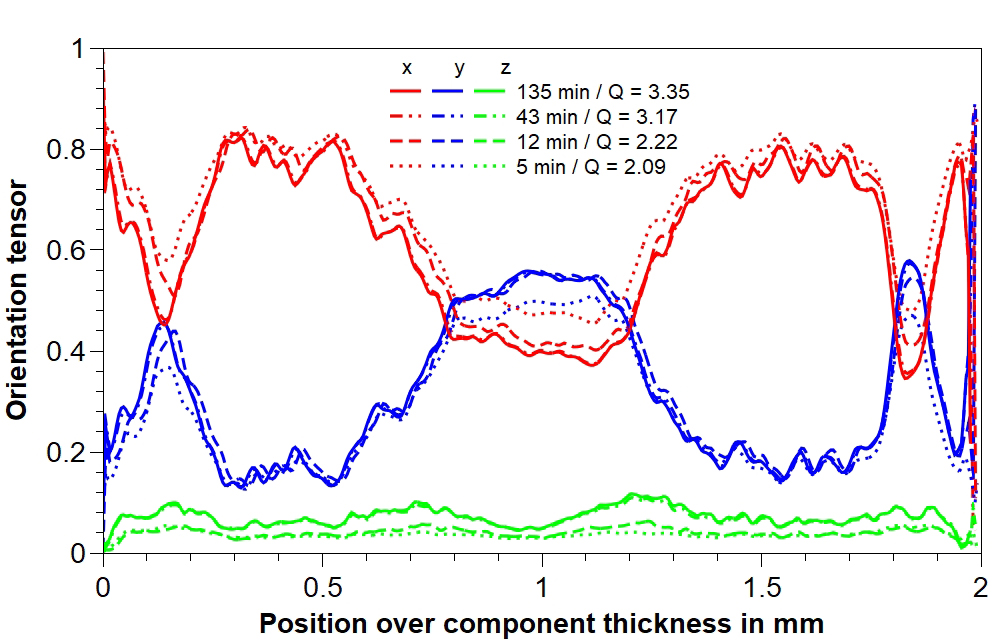
It can be assumed that the scan with 135 minutes measurement time most accurately represents the real fiber orientation. The fiber orientation analysis shows that the orientations can be determined just as precisely from the scan with 43 minutes measurement duration, although the visual observation of the image does not suggest this. Only with the significantly shorter measurement durations of 12 and 5 minutes do deviations appear in the determined fiber orientations, especially in the center of the component. The qualitative course of the orientations is still well reproduced, which speaks for a high robustness of the algorithm for fiber orientation analysis. At the same time, the potential is shown to obtain usable results with respect to fiber orientation even with significantly shortened measurement durations.
The image quality index can help to define suitable measurement parameters for the required accuracy of the fiber orientation analysis. In the further development of the image quality index, the IKK researchers will include other factors that can influence the accuracy of the fiber orientation analysis in the future.


